Plot cells located within spatial boundaries or ring regions
Source:R/PlotCellsInside.R
PlotCellsInside.RdVisualizes cells that fall within defined spatial regions
(boundaries or rings), typically obtained using
the getCellsInside() function. The cells are colored by cluster,
and the function offers two plotting modes: using geom_sf()
(with fixed 1:1 aspect ratio) or geom_point() (with more flexible layout).
Usage
plotCellsInside(
  cells_inside = NULL,
  point_size = 0.5,
  colors = colors15_cheng,
  theme_ggplot = theme_spneigh(),
  legend_size = 2,
  fixed_aspect_ratio = TRUE
)
Arguments
- cells_inside
An
sfobject of cells returned bygetCellsInside(). Must containclusterandregion_idcolumns.- point_size
Numeric. Size of the points representing cells. Default is 0.5.
- colors
A vector of cluster colors. Default uses
colors15_cheng.- theme_ggplot
A ggplot2 theme object. Default is
theme_spneigh().- legend_size
Numeric. Size of legend keys. Default is 2.
- fixed_aspect_ratio
Logical. If
TRUE, usesgeom_sf()to preserve spatial scale. IfFALSE, usesgeom_point()with extracted coordinates. Default isTRUE.
Examples
coords <- readRDS(system.file("extdata", "MouseBrainCoords.rds",
package = "SpNeigh"
))
# Obtain boundaries
boundary_points <- getBoundary(data = coords, one_cluster = 2)
# Select regions of interests if needed (Optional)
boundary_points <- subset(boundary_points, region_id == 2)
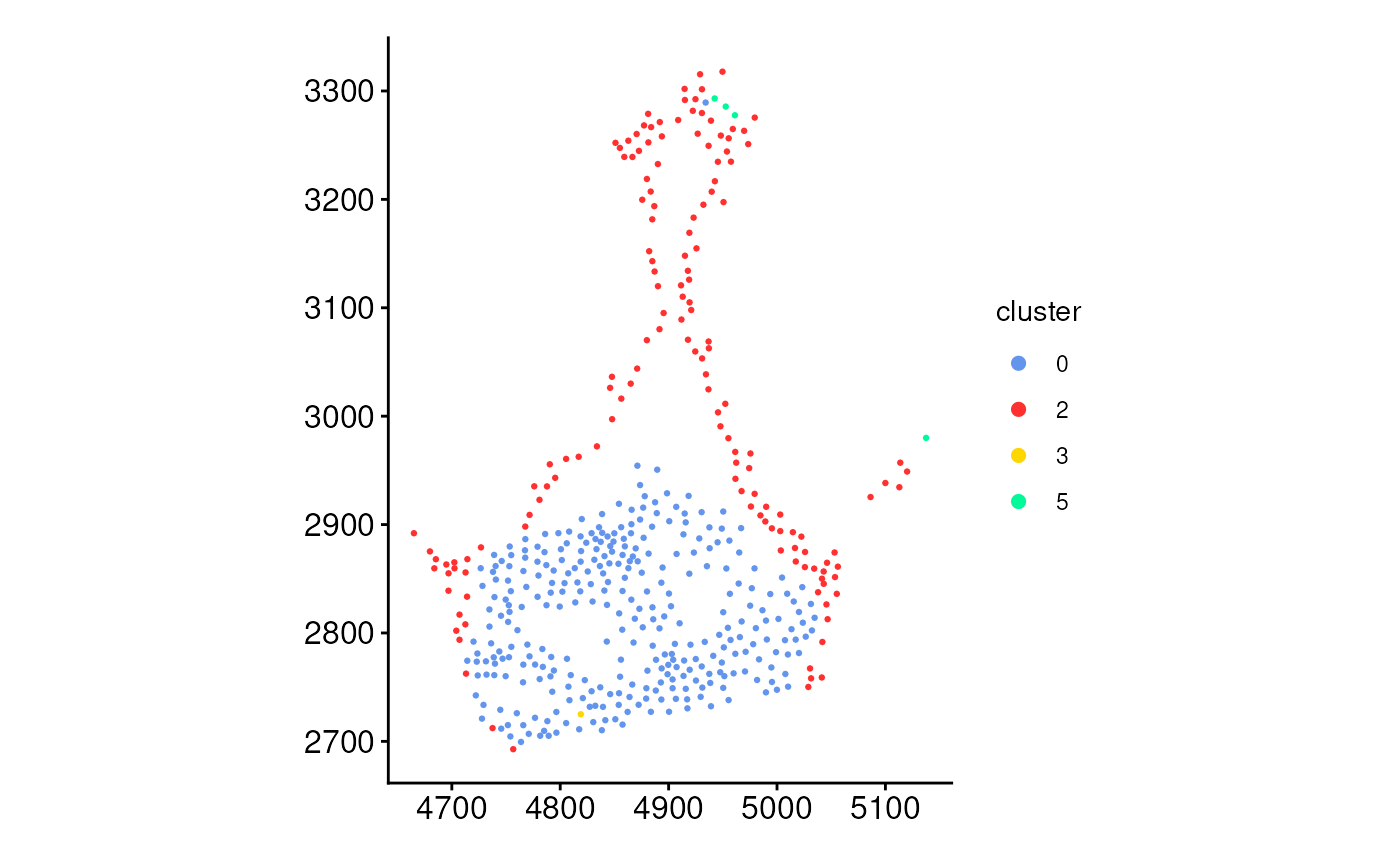
# Plot cells inside boundaries
cells_inside <- getCellsInside(data = coords, boundary = boundary_points)
plotCellsInside(cells_inside)
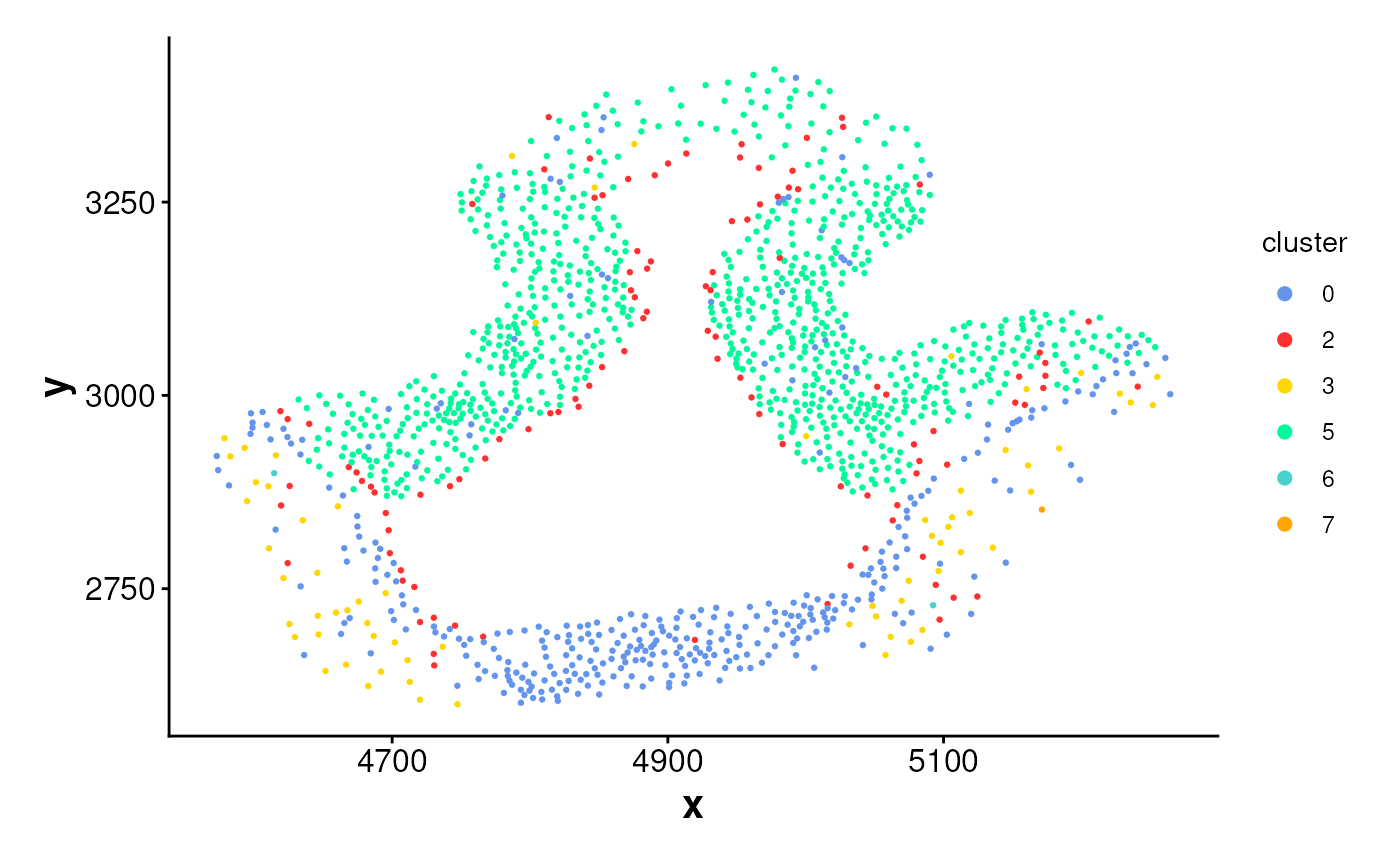
 # Plot cells inside rings
ring_regions <- getRingRegion(boundary = boundary_points, dist = 100)
cells_ring <- getCellsInside(data = coords, boundary = ring_regions)
plotCellsInside(cells_ring, fixed_aspect_ratio = FALSE)
# Plot cells inside rings
ring_regions <- getRingRegion(boundary = boundary_points, dist = 100)
cells_ring <- getCellsInside(data = coords, boundary = ring_regions)
plotCellsInside(cells_ring, fixed_aspect_ratio = FALSE)