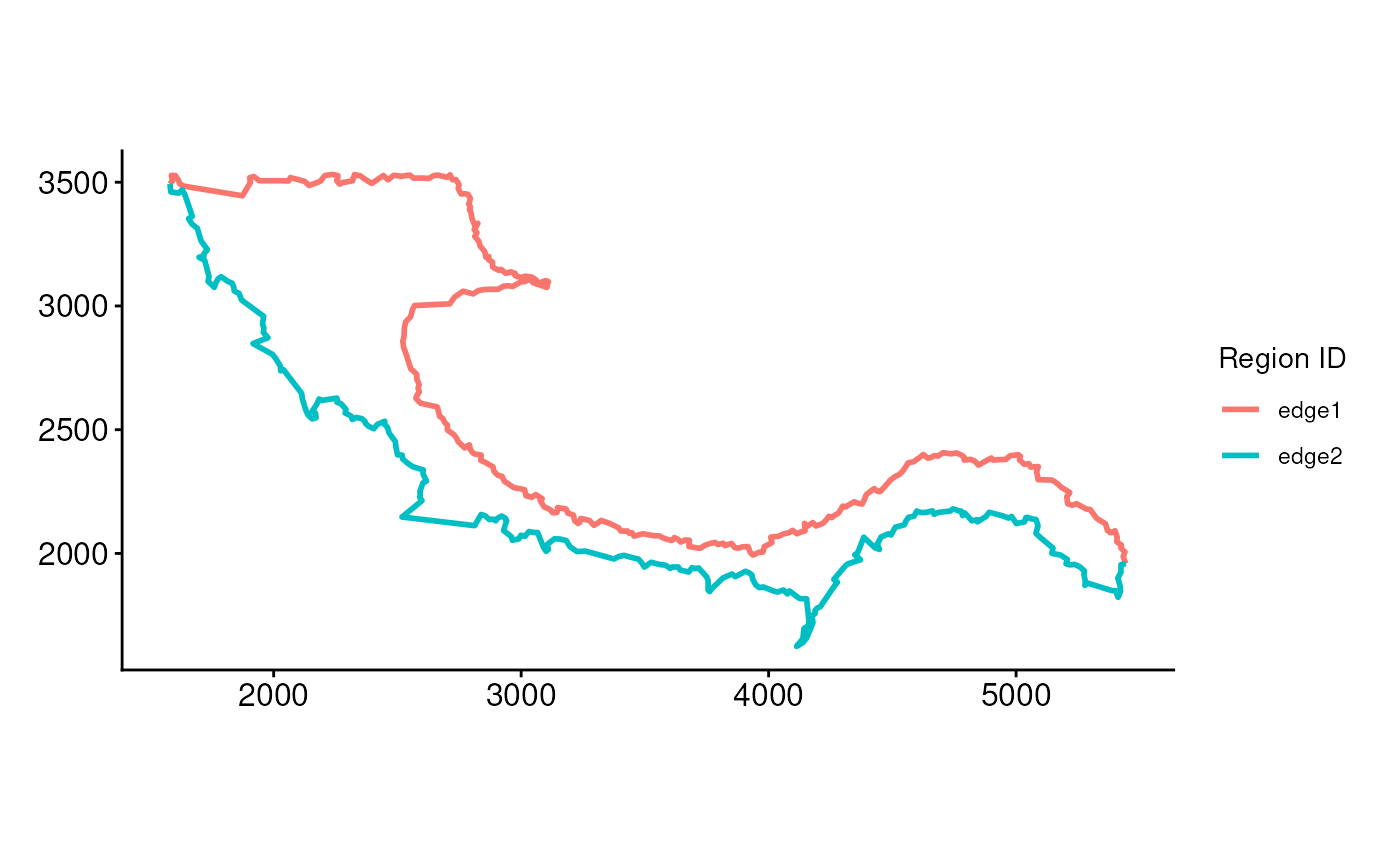
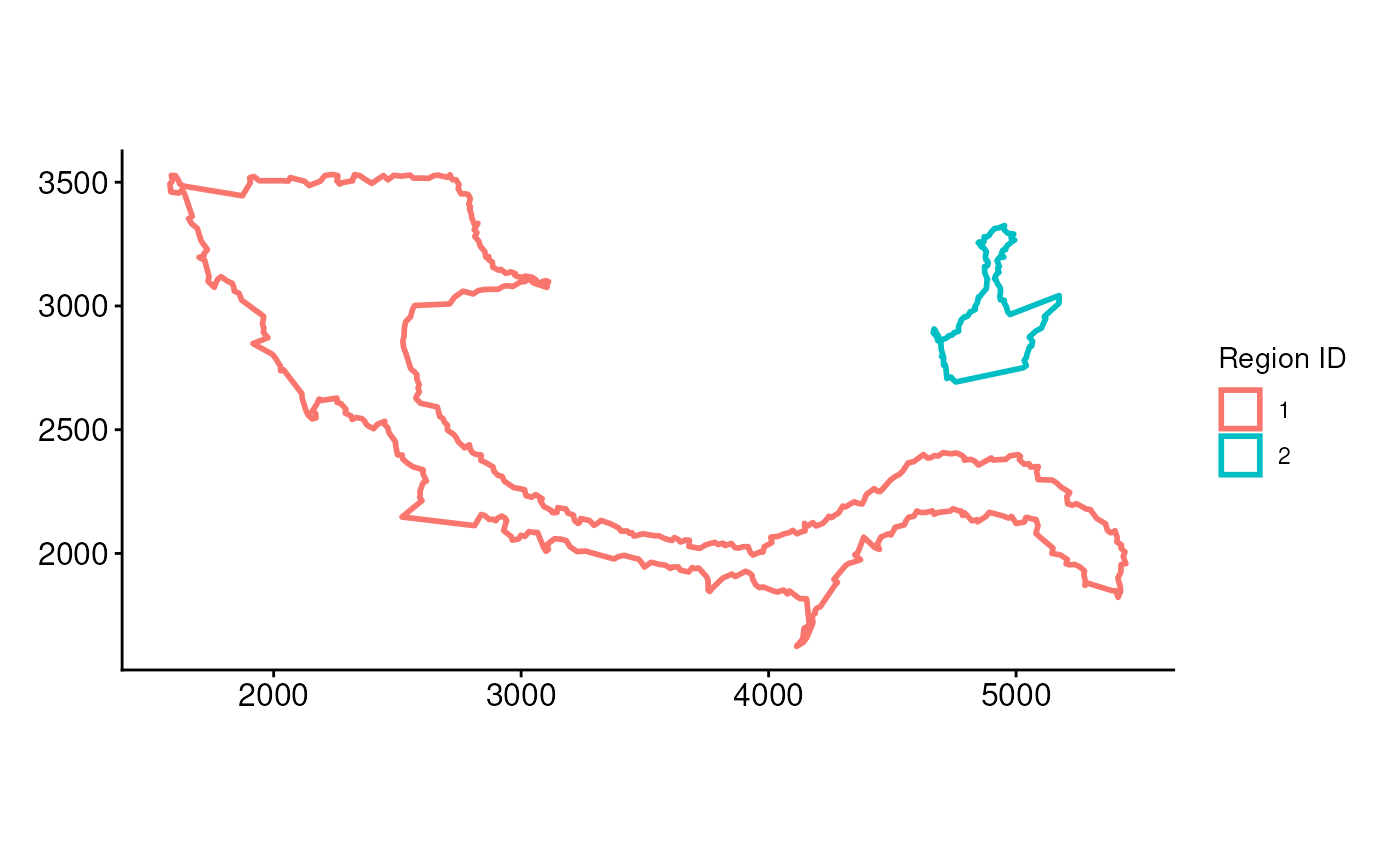
Plots boundary edges as colored LINESTRING or POLYGON outlines
using ggplot2.
This function is especially useful for visualizing specific edges
extracted from a polygon using splitBoundaryPolyByAnchor().
Usage
plotEdge(
  boundary_poly = NULL,
  linewidth_boundary = 1,
  theme_ggplot = theme_spneigh(),
  ...
)
Arguments
- boundary_poly
An
sfobject containingPOLYGONorLINESTRINGgeometries and aregion_idcolumn.- linewidth_boundary
Numeric value specifying the line width of the edge. Default is
1.- theme_ggplot
A ggplot2 theme object. Default is
theme_spneigh().- ...
Additional arguments passed to
ggplot2::geom_sf().
Examples
coords <- readRDS(system.file("extdata", "MouseBrainCoords.rds",
    package = "SpNeigh"
))

# Build boundary polygon and plot its outline
boundary_points <- getBoundary(
    data = coords, one_cluster = 2,
    eps = 120, minPts = 10
)
boundary_polys <- buildBoundaryPoly(boundary_points)
plotEdge(boundary_poly = boundary_polys)


# Split a polygon into edge segments and plot
boundary_edges <- splitBoundaryPolyByAnchor(boundary_polys[1, ])
plotEdge(boundary_poly = boundary_edges)
# Split a polygon into edge segments and plot
boundary_edges <- splitBoundaryPolyByAnchor(boundary_polys[1, ])
plotEdge(boundary_poly = boundary_edges)