Creates a ggplot of spatial regions (e.g., subregions or ring areas)
using filled polygons.
Each region is automatically assigned a fill color based on its region_id.
This function is commonly used to visualize the area inside
spatial boundaries or surrounding rings, such as those created by
buildBoundaryPoly() or getRingRegion().
Usage
plotRegion(
  boundary_poly = NULL,
  alpha = 0.5,
  color_boundary = "black",
  linewidth_boundary = 1,
  theme_ggplot = theme_spneigh(),
  ...
)
Arguments
- boundary_poly
An
sfobject ofPOLYGONgeometries containing aregion_idcolumn. Typically created bybuildBoundaryPoly()orgetRingRegion().- alpha
Numeric value controlling the transparency of the filled regions. Default is
0.5.- color_boundary
Color of the region outlines. Default is
"black".- linewidth_boundary
Numeric line width of the region borders. Default is
1.- theme_ggplot
A ggplot2 theme object. Default is
theme_spneigh().- ...
Additional arguments passed to
ggplot2::geom_sf().
Examples
coords <- readRDS(system.file("extdata", "MouseBrainCoords.rds",
package = "SpNeigh"
))
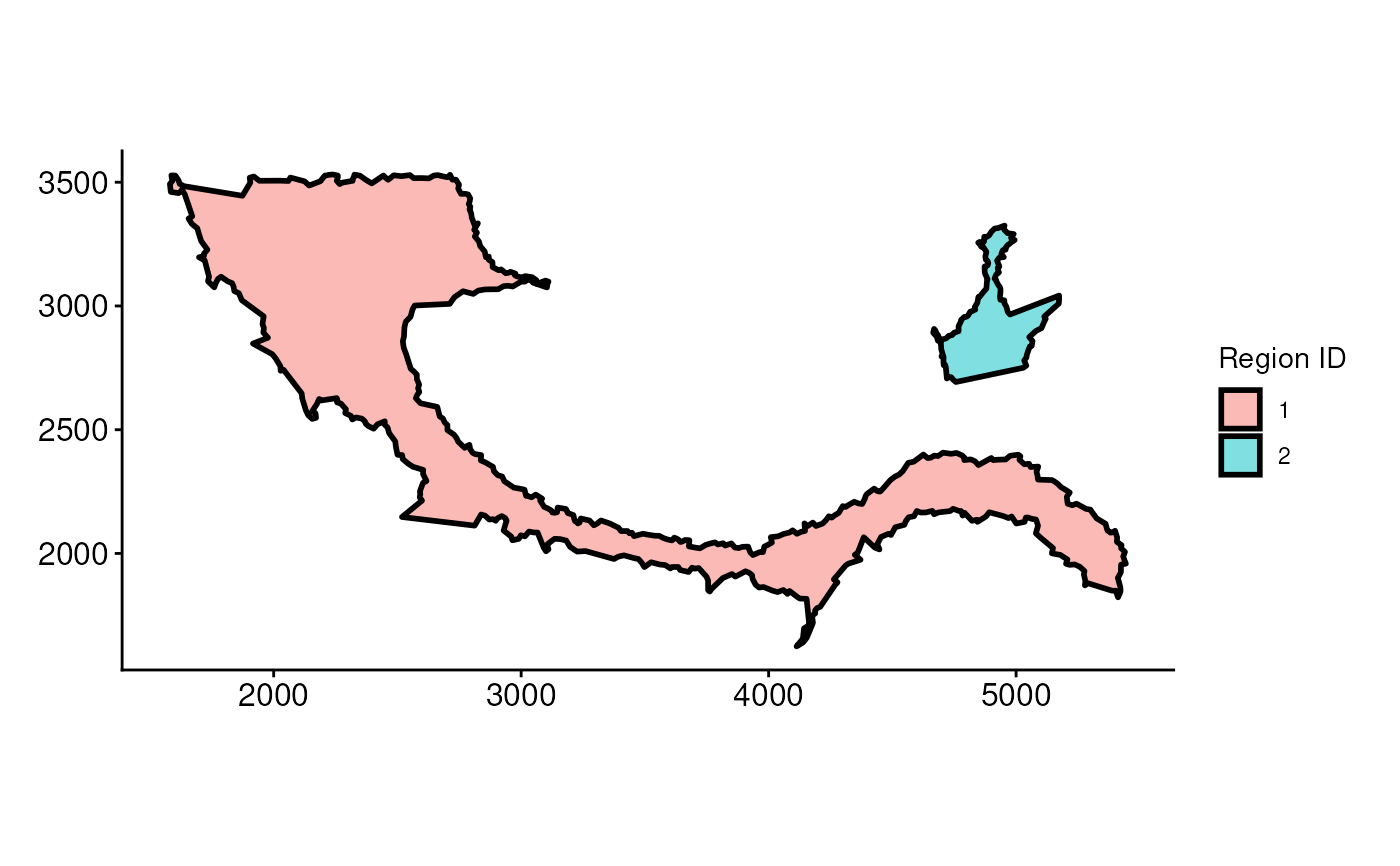
# Plot filled boundary regions
boundary_points <- getBoundary(
data = coords, one_cluster = 2,
eps = 120, minPts = 10
)
boundary_polys <- buildBoundaryPoly(boundary_points)
plotRegion(boundary_poly = boundary_polys)
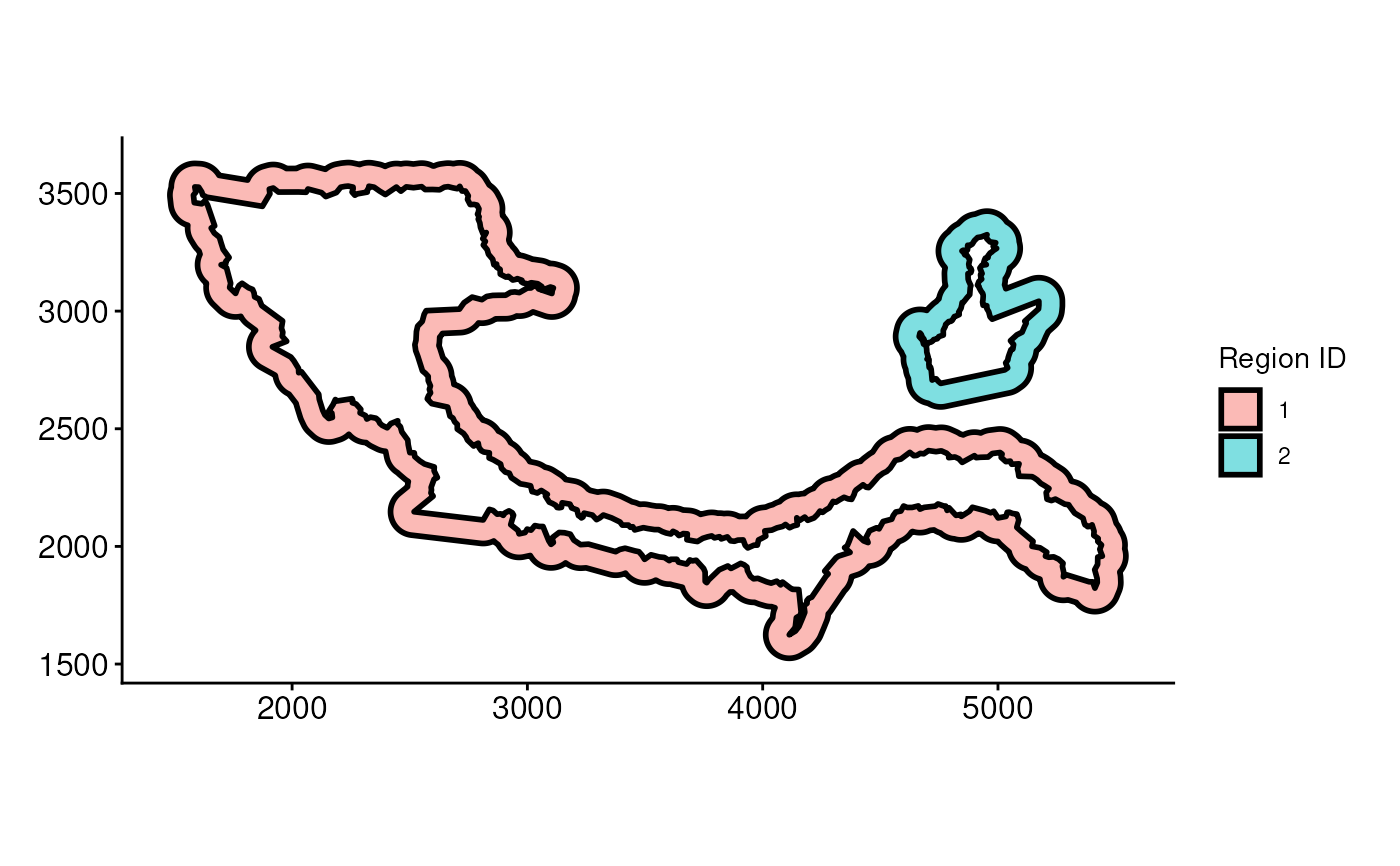
 # Plot filled ring regions
ring_regions <- getRingRegion(boundary = boundary_points, dist = 100)
plotRegion(boundary_poly = ring_regions)
# Plot filled ring regions
ring_regions <- getRingRegion(boundary = boundary_points, dist = 100)
plotRegion(boundary_poly = ring_regions)