Plot average gene expression along spatial distance
Source:R/PlotExpression.R
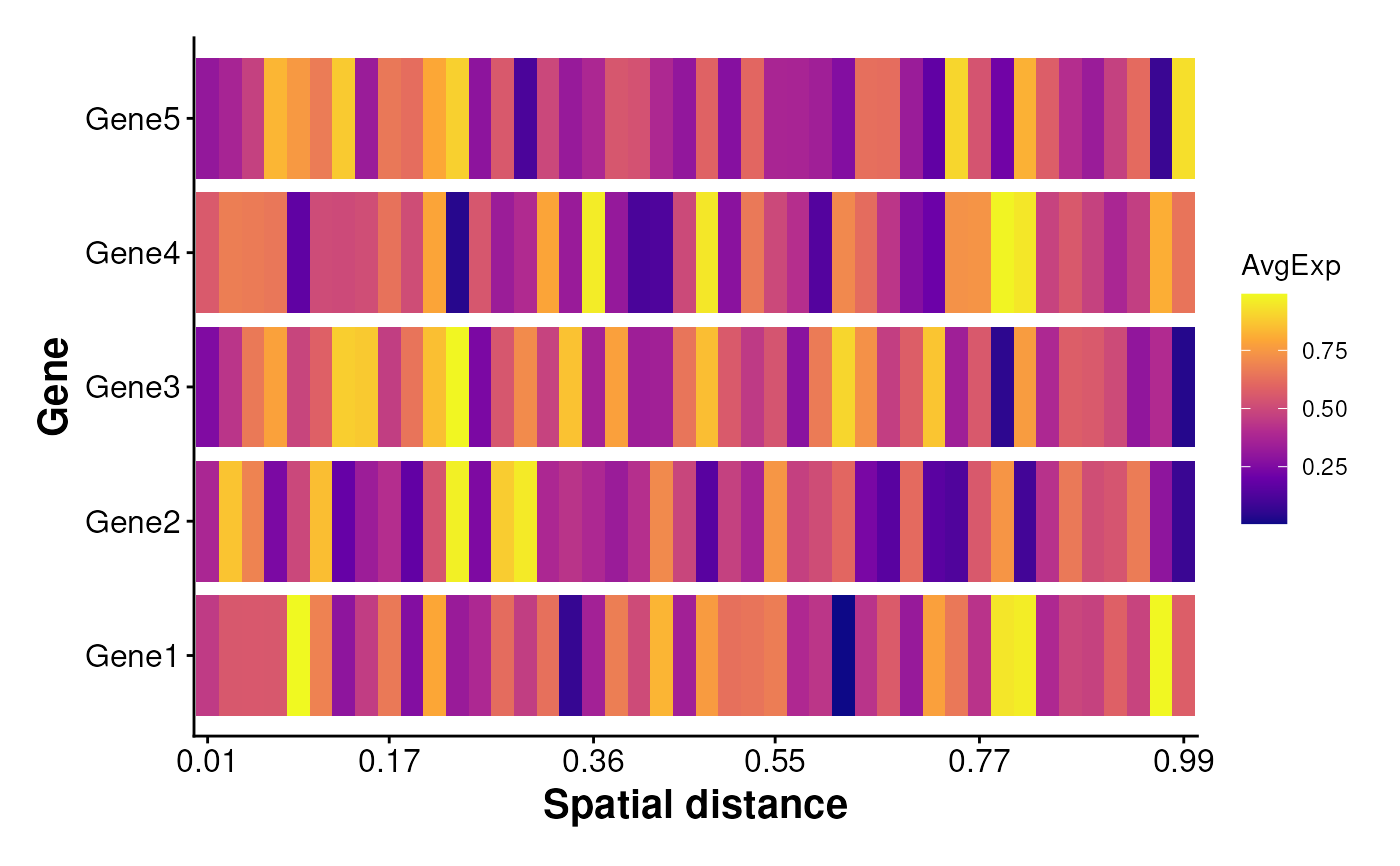
PlotSpatialExpression.RdVisualizes how the average expression of specified genes varies along a spatial distance gradient. The spatial distance is binned, and the average expression within each bin is plotted as a heatmap.
Usage
plotSpatialExpression(
  exp_mat = NULL,
  spatial_distance = NULL,
  genes = NULL,
  n_bins = 50,
  scale_method = c("none", "zscore", "minmax"),
  n_labels = 6,
  row_gap = 0.1,
  column_gap = 0,
  label_x = "Spatial distance",
  label_y = "Gene",
  theme_ggplot = theme_spneigh()
)
Arguments
- exp_mat
A normalized gene expression matrix (genes x cells), either a
matrixordgCMatrix. Typically log-normalized counts, e.g., from a Seurat object.- spatial_distance
A named numeric vector containing the spatial distance (or weights) for each cell.
- genes
Character vector specifying gene names to be plotted. Must match row names in
exp_mat.- n_bins
Integer. Number of bins to divide the spatial distance into. Default is
50.- scale_method
A string indicating how to scale the average expression values across bins for each gene. Options are:
"none"No scaling (default). The average expression is plotted as-is.
"zscore"Standardize expression (mean 0, SD 1) per gene using
scale()."minmax"Normalize expression to [0, 1] range per gene using
scales::rescale().
- n_labels
Integer. Number of axis labels to show along the distance axis. Default is
6.- row_gap
Numeric between 0 (inclusive) and 1 (exclusive). Gap between rows (genes) in the plot. Default is
0.1.- column_gap
Numeric between 0 (inclusive) and 1 (exclusive). Gap between columns (distance bins) in the plot. Default is
0.- label_x
Character. Label for the x-axis. Default is "Spatial distance".
- label_y
Character. Label for the y-axis. Default is "Gene".
- theme_ggplot
A ggplot2 theme object. Default is
theme_spneigh().