Draw a ternary plot
vcdTernaryPlot_functions.RdvcdTernaryPlot() is modified from vcd::ternaryplot() and can be used to draw a ternary plot.
vcdTernaryPlot(
  data = NULL,
  order_colnames = c(3, 2, 1),
  group = NULL,
  group_levels = levels(factor(group)),
  group_color = NULL,
  label_position_x = c(0.1, 0.9, 0.5),
  label_position_y = c(0.05, 0.05, 0.85),
  show_legend = FALSE,
  legend_position = c(0.1, 0.5),
  prop_size = FALSE,
  point_shape = 16,
  point_size = 0.5,
  label_text_size = 1.2,
  legend_point_shape = 16,
  legend_point_size = 0.5,
  legend_text_size = 1.5,
  legend_vertical_space = 1.5,
  scale_legend = 0.5,
  n_col = NULL,
  facet = FALSE,
  title = NULL
)
Arguments
- data
A data.frame or matrix of three columns
- order_colnames
A vector to order the three columns
- group
A vector to specify row (cell) annotation or classification
- group_levels
Levels of the group vector, default is levels(factor(group))
- group_color
Colors used for the group levels
- label_position_x
X positions for the three labels
- label_position_y
Y positions for the three labels
- show_legend
Whether to show the legend
- legend_position
Legend position, e.g., 'right' or 'center' or c(0.1,0.5)
- prop_size
Same parameter used in vcd::ternaryplot(), if TRUE, the symbol size is plotted proportional to the row sum of the three variables
- point_shape
Shape for the point, default is pch 16
- point_size
Size of point, default is 0.5
- label_text_size
Size of the three labels, default is 1.2
- legend_point_shape
Shape for the point of legend, default is pch 16
- legend_point_size
Size of point of legend, default is 0.5
- legend_text_size
Text size of legend, default is 1.5
- legend_vertical_space
Vertical space between legend texts, default is 1.5 (lines)
- scale_legend
Scaled width of legend
- n_col
Number of columns for plotting
- facet
whether to show facets
- title
Title of the ternary plot, default is NULL
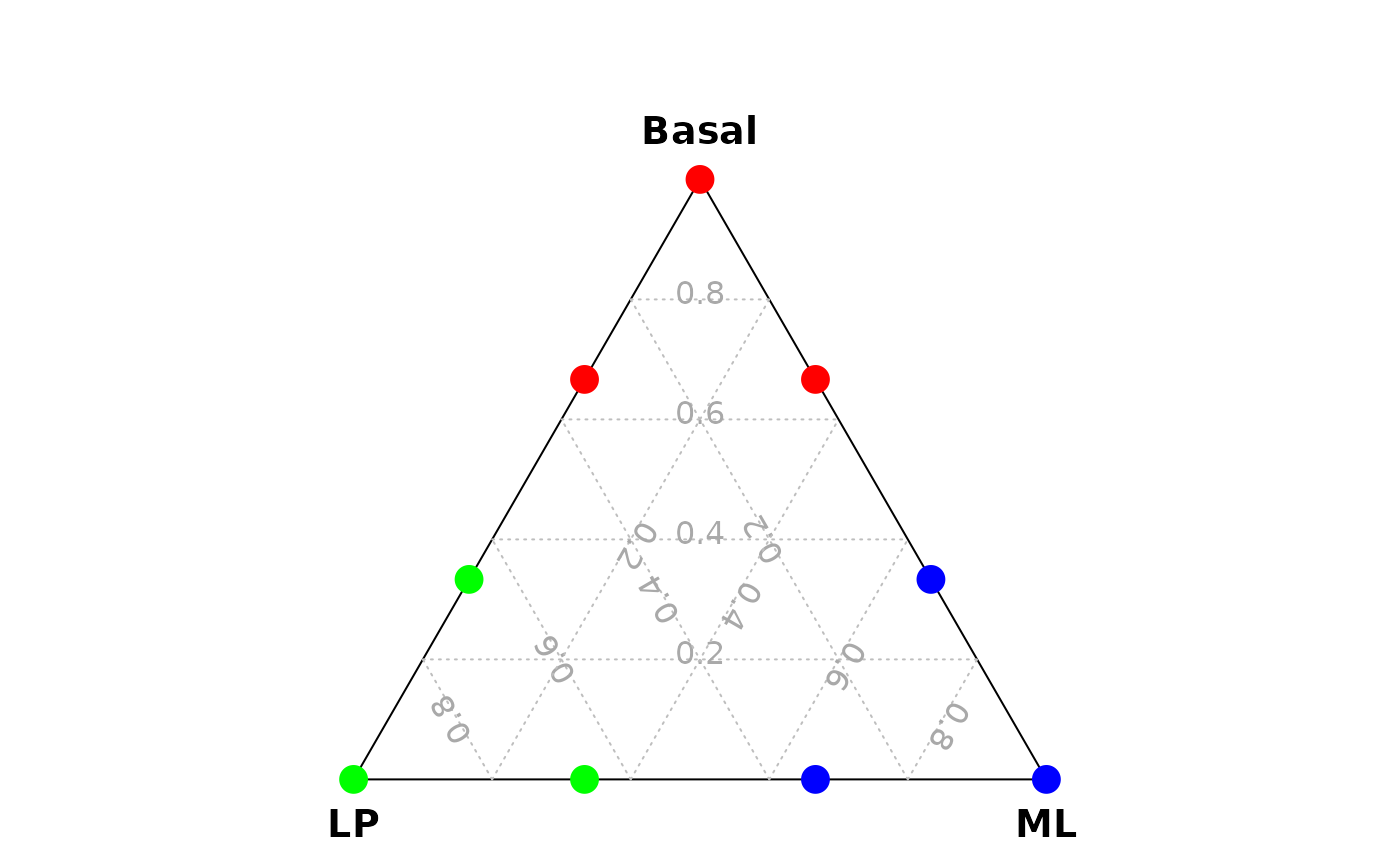
Examples
data_for_ternary <- data.frame(Basal = c(1,2,2,0,0,1,0,1,0),
                              ML    = c(0,1,0,1,2,2,0,0,1),
                              LP    = c(0,0,1,0,1,0,1,2,2) )

vcdTernaryPlot(data = data_for_ternary,
               group = rep(c("Bas","ML","LP"),each=3),
               group_levels = c("Bas","LP","ML"),
               group_color = c("red","green","blue"),
               point_size = 1,
               legend_point_size = 0.6)