Overlays spatial boundaries (from points or polygons) onto
a ggplot2 object.
The input can be either a data frame of boundary points or an sf object
of POLYGON geometries.
This function is typically used as an additive layer (+ addBoundary(...))
in conjunction with a base plot created using plotBoundary().
Value
A ggplot2::geom_path layer that can be added to an existing plot.
Examples
coords <- readRDS(system.file("extdata", "MouseBrainCoords.rds",
package = "SpNeigh"
))
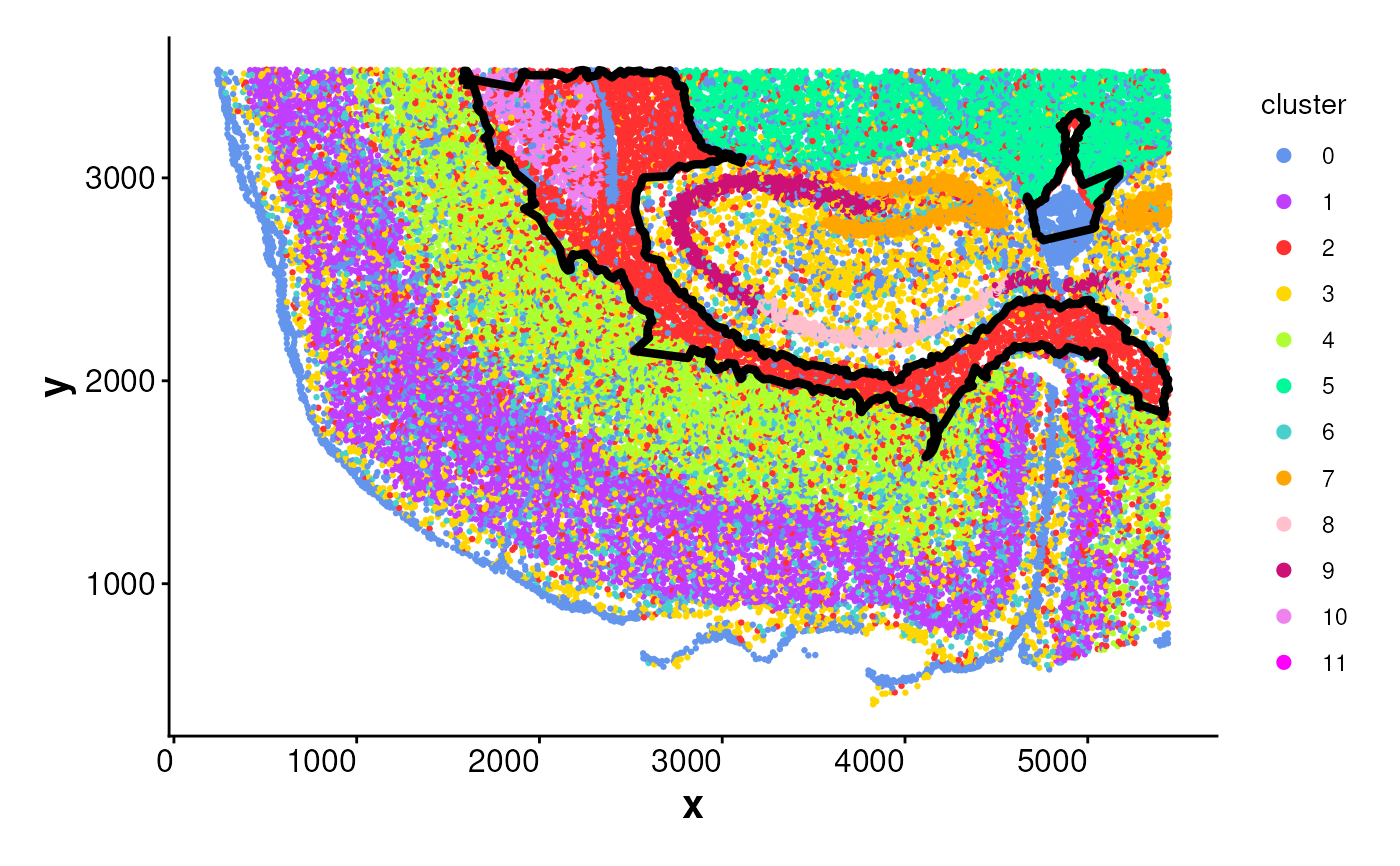
# Automatically get boundary for a cluster
boundary_points <- getBoundary(
data = coords, one_cluster = 2,
subregion_method = "dbscan",
eps = 120, minPts = 10
)
# Plot with boundary overlay
plotBoundary(coords) + addBoundary(boundary_points)