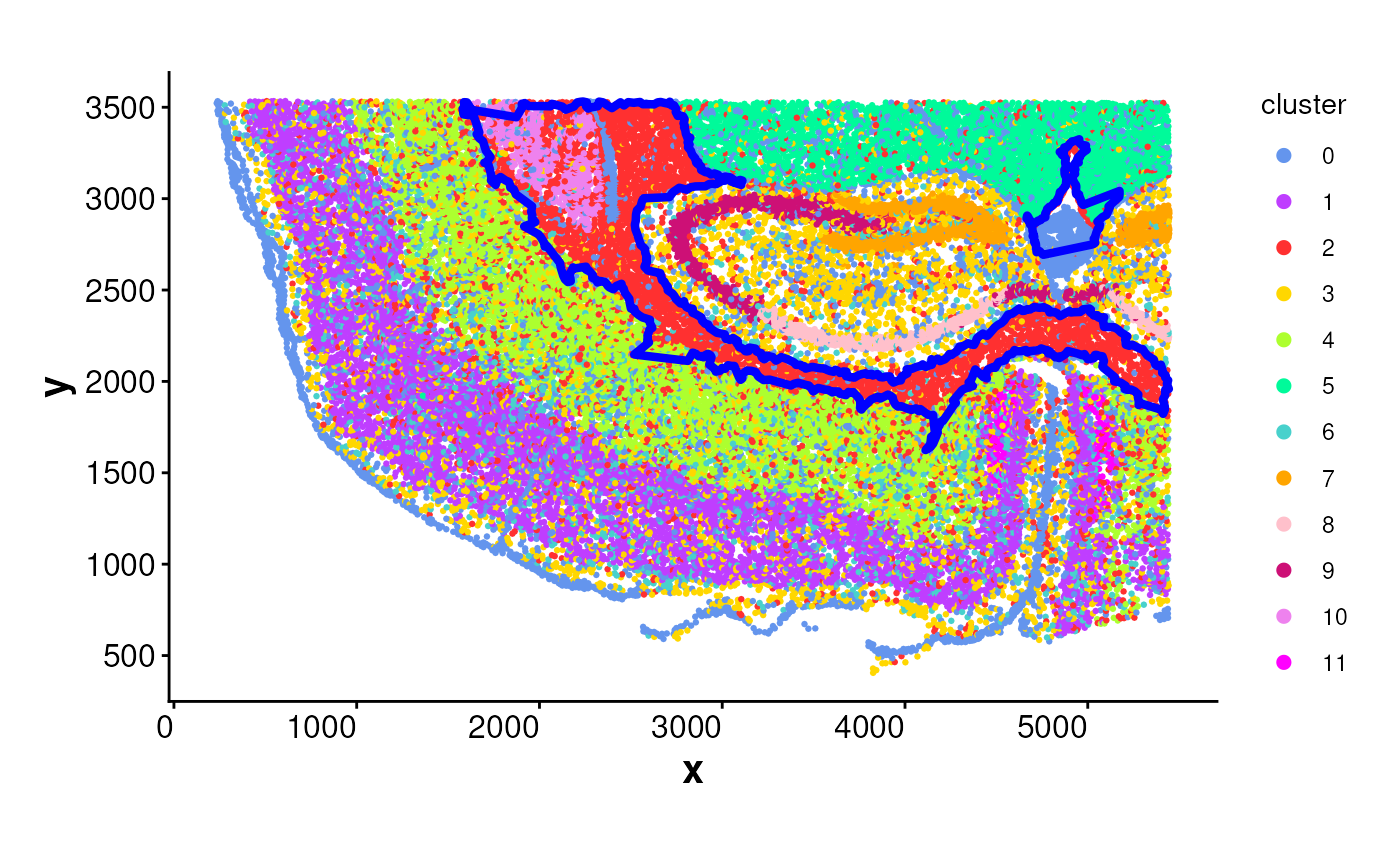
Overlays boundary polygons or linestrings
on a spatial ggplot2 plot. This function adds an sf geometry layer
to display complete boundary shapes for visualizing spatial clusters,
rings, or enriched zones.
Value
A ggplot2::geom_sf layer that can be added to an existing plot.
Examples
coords <- readRDS(system.file("extdata", "MouseBrainCoords.rds",
    package = "SpNeigh"
))

boundary_points <- getBoundary(
    data = coords, one_cluster = 2,
    subregion_method = "dbscan",
    eps = 120, minPts = 10
)
boundary_polys <- buildBoundaryPoly(boundary_points)

# Add boundary polygons to the plot
plotBoundary(coords) +
    addBoundaryPoly(boundary_polys, color_boundary = "blue")