Generate data for ternary plot
generate_data_for_ternary.RdGenerate a three column matrix which can be used to draw a ternary plot.
generate_data_for_ternary(
  data_exp_mat = NULL,
  anno_signature_genes = NULL,
  gene_name_col = "GeneID",
  gene_type_col = "gene_type",
  weight_by_gene_count = TRUE,
  print_gene_num = FALSE,
  cutoff_exp = 0,
  prior_count = 2
)
Arguments
- data_exp_mat
An expression matrix, e.g., raw count matrix or log2CPM matrix
- anno_signature_genes
A data.frame containing signature gene annotation
- gene_name_col
Colname name of row (gene) names used in the expression matrix
- gene_type_col
Colname name of signature gene type annotation
- weight_by_gene_count
Whether to divide the signature gene number by the total signature gene name, default is TRUE
- print_gene_num
Print the signature gene number or not
- cutoff_exp
Expression cut-offs used to count the signature gene number
- prior_count
Add a prior count to avoid signature gene number to be 0, default is 2 but can be set to a different one
Examples
library(scTernary)
# Generate data for ternary plots
# using a CPM matrix and a CPM cut-off of 100
data_for_ternary <- generate_data_for_ternary(
data_exp_mat = edgeR::cpm(example_dge_data$counts,
log = FALSE),
anno_signature_genes = anno_signature_genes_mouse,
gene_name_col = "GeneID",
gene_type_col = "gene_type",
weight_by_gene_count = FALSE,
cutoff_exp = 100,
prior_count = 0
)
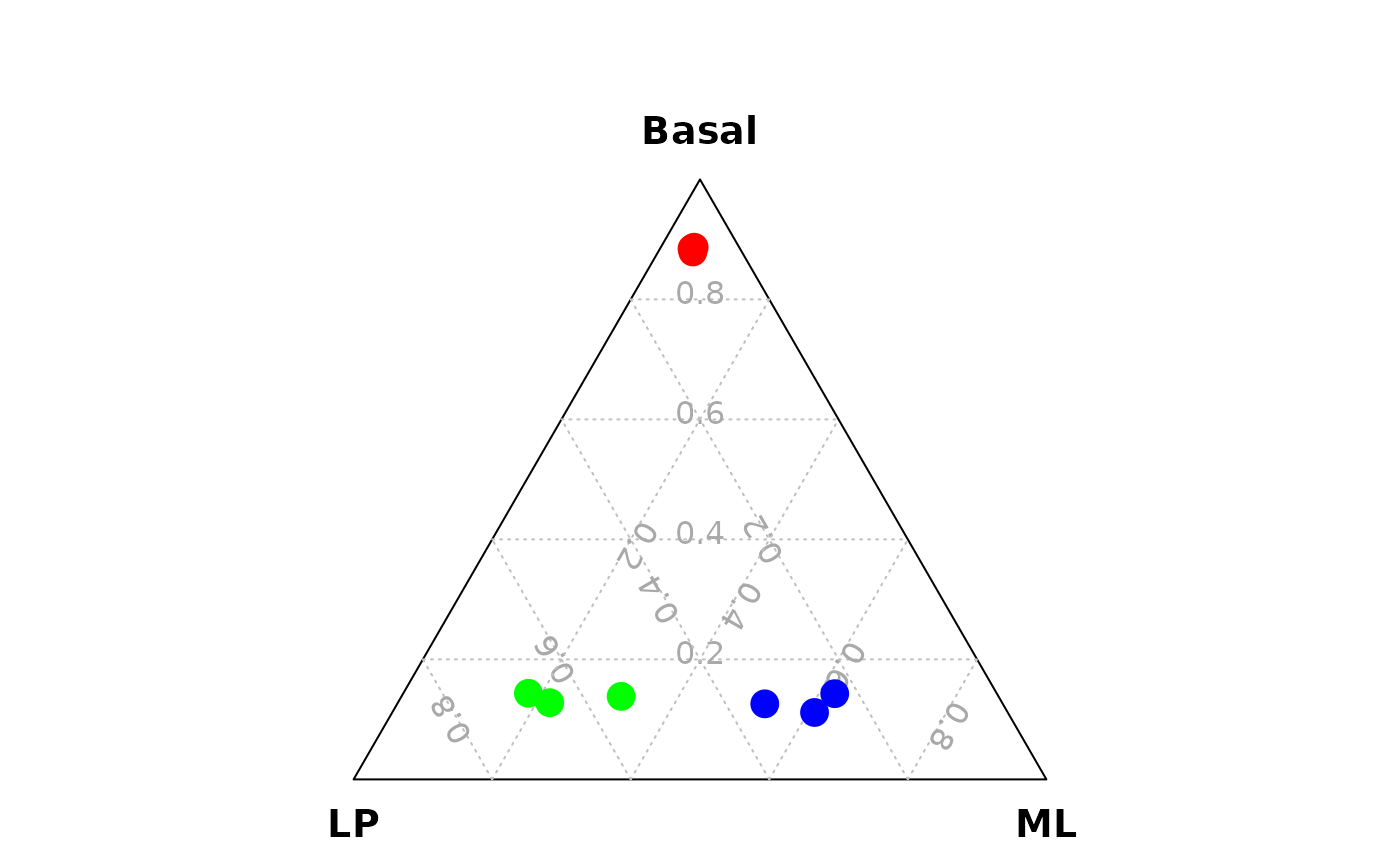
vcdTernaryPlot(data = data_for_ternary,
order_colnames = c(2,3,1),
group = example_dge_data$samples$group,
group_color = c("red","green","blue"),
point_size = 1,
legend_point_size = 0.6,
legend_position = c(0.3,0.5),
scale_legend = 1)