Estimate the optimized cut-off
estimate_optimized_cutoffs.RdEstimate the optimized cut-off that maximizes the coefficient of variation (CV) of each cell or sample.
estimate_optimized_cutoffs(
  data_exp_mat = NULL,
  interval = seq(from = floor(min(data_exp_mat)), to = ceiling(max(data_exp_mat)),
    length.out = 1000),
  gene_name_col = "GeneID",
  gene_type_col = "gene_type",
  anno_signature_genes = NULL,
  weight_by_gene_count = TRUE,
  prior_count = 2,
  do_parallel = TRUE,
  n_cores = NULL
)
Arguments
- data_exp_mat
An expression matrix, e.g., raw count matrix or log2CPM matrix
- interval
A sequence of cut-offs used for calculating the CVs, and the cut-off that maximize the CV is the optimized cut-off
- gene_name_col
Colname name of row (gene) names used in the expression matrix
- gene_type_col
Colname name of signature gene type annotation
- anno_signature_genes
A data.frame containing signature gene annotation
- weight_by_gene_count
Whether to divide the signature gene number by the total signature gene name, default is TRUE
- prior_count
Add a prior count to avoid signature gene number to be 0, default is 2 but can be set to a different one
- do_parallel
Whether do parallel computation or not, logical value, default is TRUE
- n_cores
Number of cores used for parallel computation, half of the total cores will be used if not provided
Examples
# Set 'weight_by_gene_count' to TRUE is recommended for estimating the optimized cut-offs
start_time <- proc.time()
estimated_cutoffs <- estimate_optimized_cutoffs(
data_exp_mat = edgeR::cpm(example_dge_data$counts,
log = TRUE),
anno_signature_genes = anno_signature_genes_mouse,
gene_name_col = "GeneID",
gene_type_col = "gene_type",
weight_by_gene_count = TRUE,
prior_count = 2,
do_parallel = TRUE,
n_cores = 2
)
end_time <- proc.time() - start_time
end_time[3]
#> elapsed
#> 3.05
estimated_cutoffs
#> 10_6_5_11 9_6_5_11 purep53 JMS8-2 JMS8-3 JMS8-4 JMS8-5 JMS9-P7c
#> 9.354354 11.496496 8.053053 9.774775 11.896897 10.075075 8.553554 8.253253
#> JMS9-P8c
#> 10.675676
data_for_ternary <- generate_data_for_ternary(
data_exp_mat = edgeR::cpm(example_dge_data$counts,
log = TRUE),
anno_signature_genes = anno_signature_genes_mouse,
gene_name_col = "GeneID",
gene_type_col = "gene_type",
weight_by_gene_count = TRUE,
cutoff_exp = estimated_cutoffs,
prior_count = 2
)
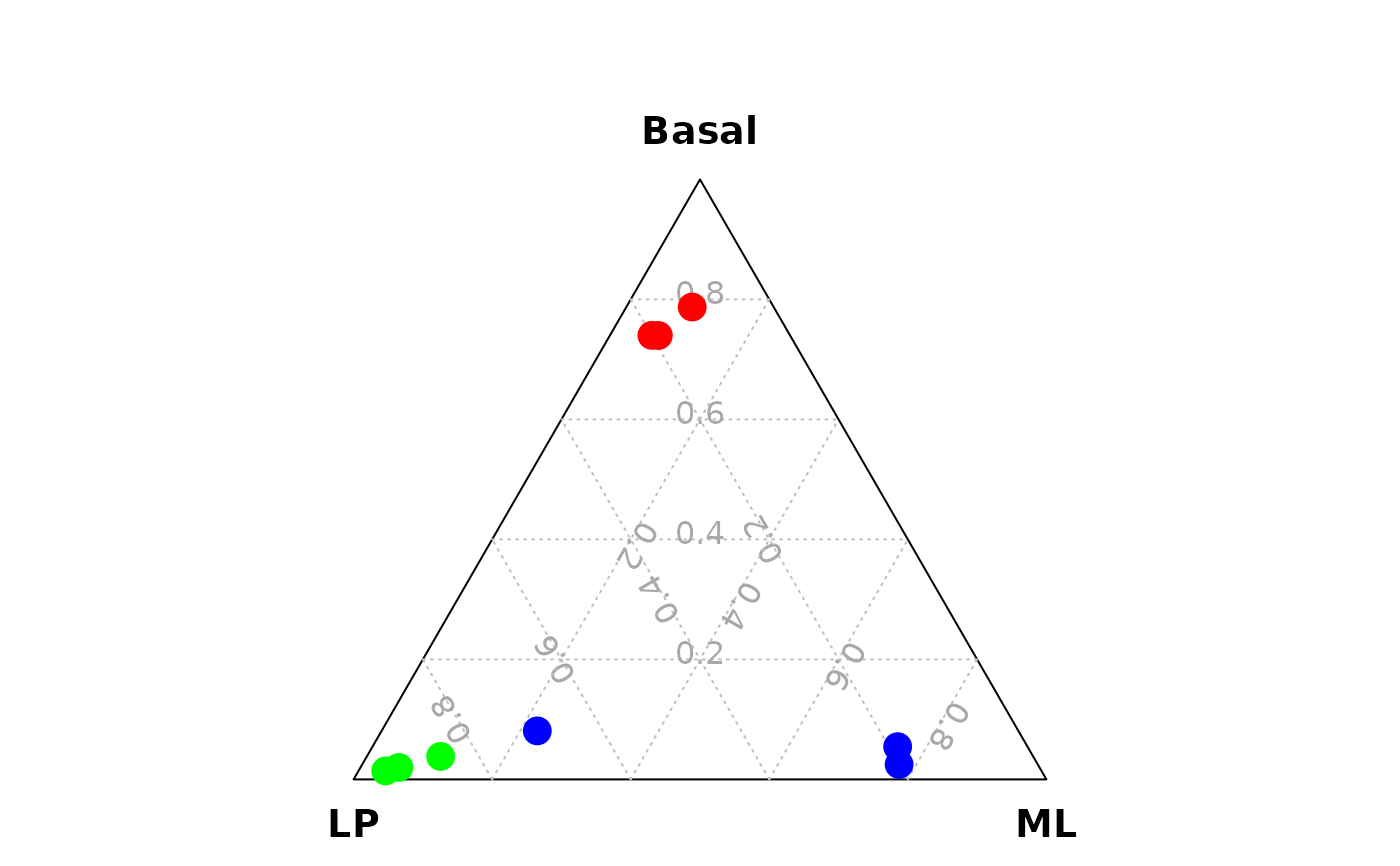
vcdTernaryPlot(data = data_for_ternary,
order_colnames = c(2,3,1),
group = example_dge_data$samples$group,
group_color = c("red","green","blue"),
point_size = 1,
legend_point_size = 0.6,
legend_position = c(0.3,0.5),
scale_legend = 1)